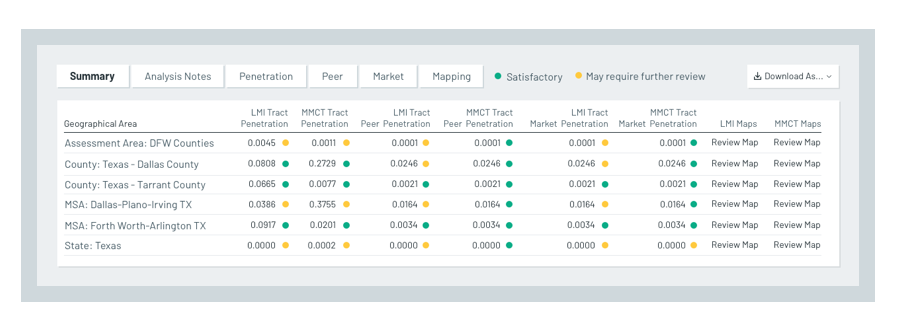
Visualize an institution’s overall performance summary through RiskExec’s module, which displays individual outcomes for each in-scope geography. Geographies can be selected for inclusion at the State, MSA, County and Assessment Area levels based on a combination of factors including the traditional LMI and MMCT metrics along with Majority-Black, Majority-Hispanic, and Majority-Black-Hispanic census tracts.
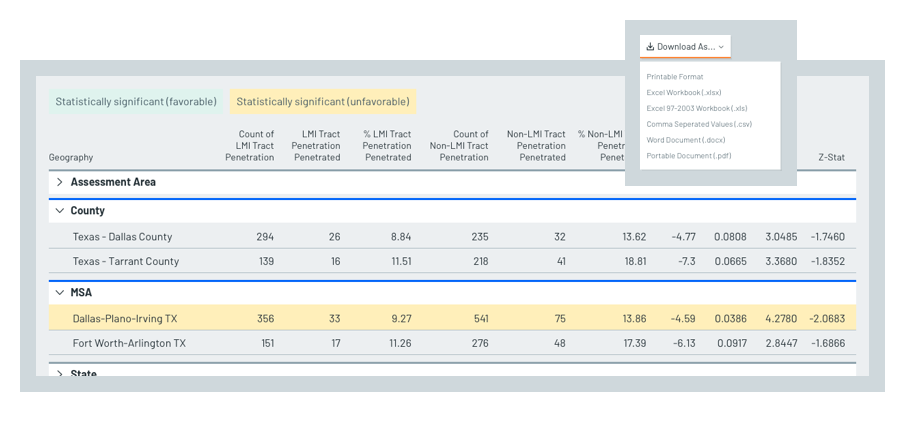
Compare tract penetration rates in majority-minority or LMI census tracts to non-majority-minority and non-LMI census tracts.
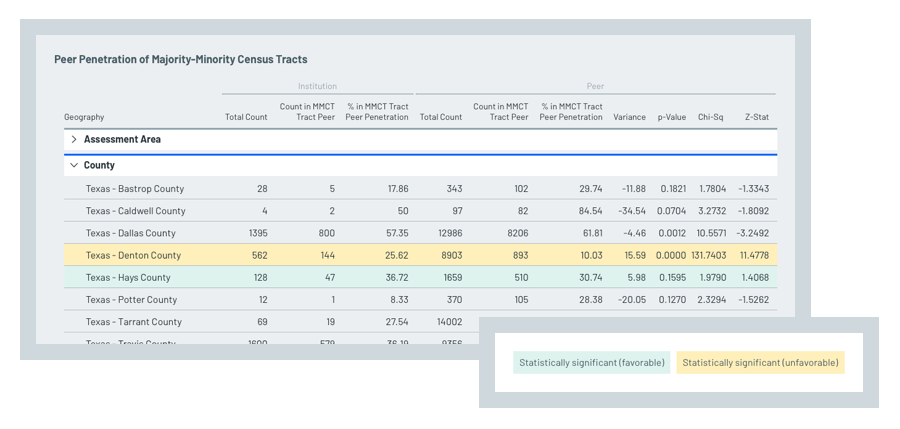
Compare lending performance in majority-minority or LMI census tracts to target peer groups and the market aggregate.
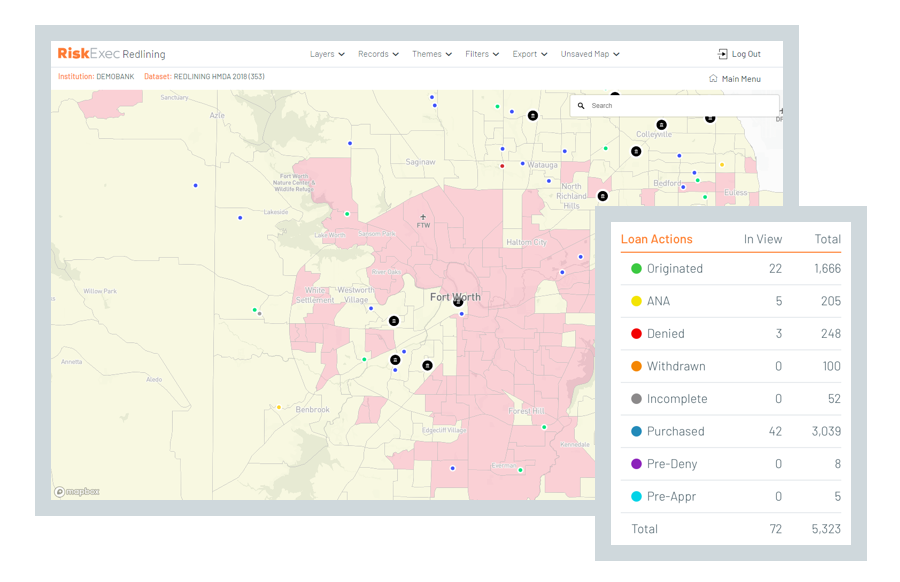
Visually assess lending patterns in majority-minority or LMI census tracts.
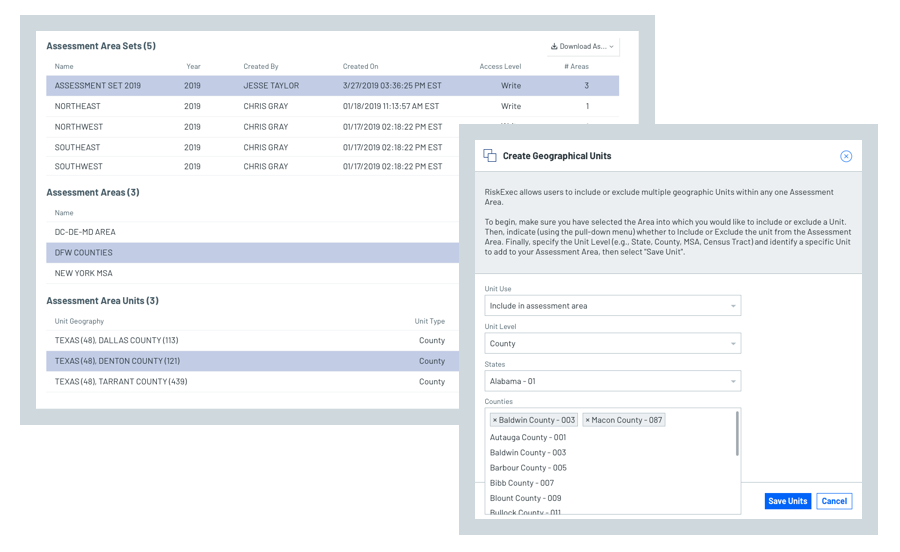
Create custom assessment areas or reasonably expected marketing areas (REMAs) down to the tract level. Understand where your customers are, identify gaps, and recognize opportunities for community outreach directly on the map by plotting out your lending, deposit accounts, branches, ATMs, and more.
After 8+ years of using the RiskExec software, the reliability and the technical support continue to be top-notch. Thank you for consistently providing outstanding service.
Vice-President/Client Technology Solutions, Bank of New York Mellon

Just wanted to thank you guys for getting the large geocoding request completed for us in a condensed time frame. The information was quite useful to us and we had a tight deadline for the information.
Compliance Executive, Regions Bank

RiskExec reports help show how we compare to other financial institutions in terms of HMDA and CRA Small Business lending activities, and helps us set goals for future performance that will earn us favorable exam ratings.
Compliance Executive, Regions Bank